Wednesday, May 30, 2012

Jim Rogers on Gold. Start the video at 19:00.


GOLD / Jim Rogers target:


Now let me show you what I have been saying all along according to the charts. Jim Rogers happens to agree.

Recent chart, this chart has been posted on here many times:


Likely long term pattern for Gold:


Below is a 3-year chart of the CRB index (Commodity index). We have not been this oversold in 3 years.


Sunday, May 13, 2012

Gold. Long position nearing.

This time I am going to take a second for some history on my Gold charts. For those who do not want to search the archives. We will start with the most recent chart, being the most important.

Gold Long position opportunity:


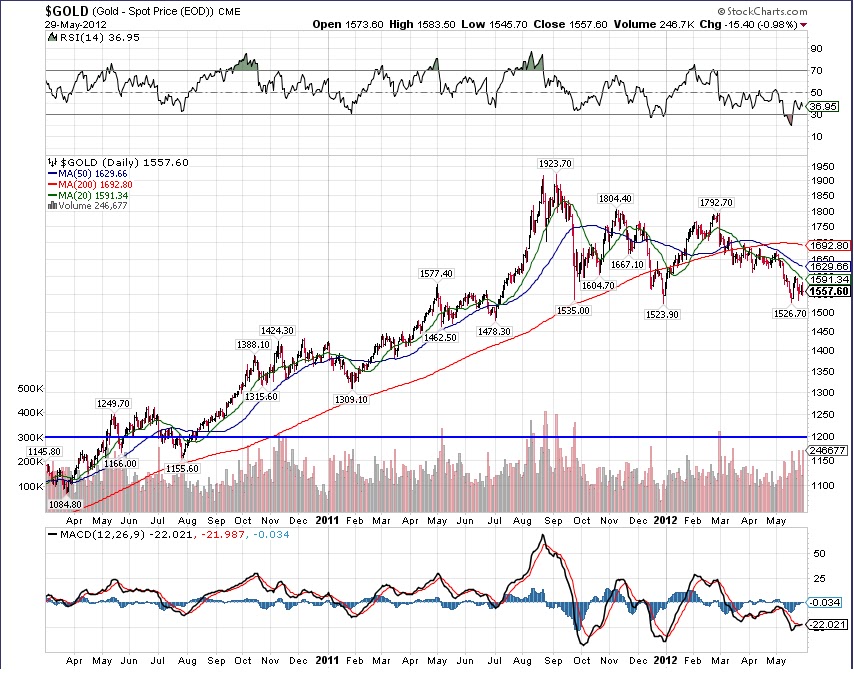
The history of my Gold charts and their accuracy:


Previous short position:
Support trade:

Trend re-test trade:

GDX Gap fill trade:


My coined "Fat Finger Trade"


Tags:
SPX SPY SP500 S&P S & P 500 Market Markets resistance support range trading how to trade E-mini Emini Futures Commodities. Make money in stocks corn oil crude Dow Jones DJI stock market stockmarket rice beans gold silver GLD SIL SLV US dollar US-Dollar DX june april march may august prediction forecast better trading how to make money how to trade investing annuities self employment be your own boss work from home make a living do what you like not what you have to

Wednesday, May 9, 2012

SP-500 / SPY Range support. See previous post on range trading rules.

SP-500


Tags:
SPX SPY SP500 S&P S & P 500 Market Markets resistance support range trading how to trade E-mini Emini Futures Commodities. Make money in stocks corn oil crude Dow Jones DJI stock market stockmarket rice beans gold silver GLD SIL SLV US dollar US-Dollar DX june april march may august prediction forecast better trading how to make money how to trade investing annuities self employment be your own boss work from home make a living do what you like not what you have to